

DASYLab in Medical Research
Project: Bachelor thesis by Tobias Wohnhas in sports science at the Ruprecht-Karls-Universität Heidelberg
Area: Research / Neurology & Sports
Requirements: Measurement and evaluation of the body's own electrical signals during muscular excitation (EMG examination)
Implementation: Hardware: EMG device ; Software DASYLab
Investigation of the body's own electrical signals during muscular excitation
The demand for high-quality and biomechanically correct training equipment in the rehabilitation and prevention of musculoskeletal diseases (lumbar or cervical spine syndrome, etc.) is enormously high. They are one of the most important pillars of a good therapy facility. As part of his bachelor thesis, Tobias Wohnhas used EMG measurements to test how different strength devices activate the muscles.
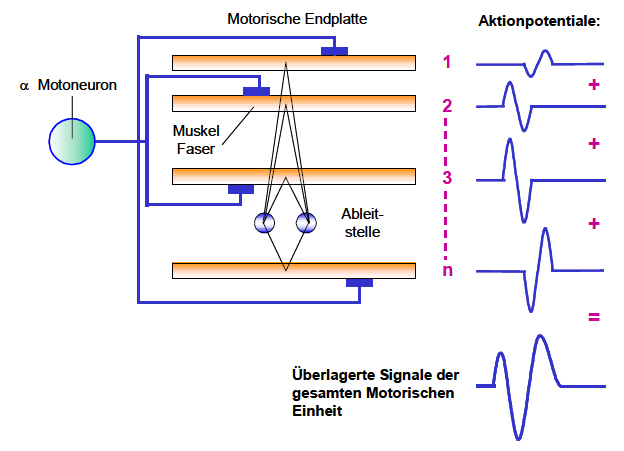 Figure 1: Superposition of several electrical impulses from different muscle fibers (Basmajian, 1985, p. 86)1 Electromyography, or EMG for short, makes it possible to take a "look into the muscles". Here, the dipole voltage generated in the presence of an action potential (AP) is measured. Each muscle works in the same way in this area. If a signal stimulus (action potential) arrives from the brain via the nerve tracts in the skeletal muscles, the following process takes place at different strengths: The incoming stimulus is transferred to the muscle fibres at the motor end plate by means of neurotransmitters via the synaptic cleft. There, due to the stimulus, the calcium ion concentration changes and a brief opening of the "doors" of the cell membrane occurs. On the electrical level, this leads to a re-polarization of the cell from a resting membrane potential of -80 mV to approximately +30 mV. This represents exactly the voltage that can be measured on the surface by means of electrodes. In addition, all electric fields of all controlled muscle fibers of the controlled muscle are superimposed (Figure 1). If a muscle is activated, this results in a change in tension, which further leads to the muscle contracting in its smallest units (sarcomeres). It therefore contracts. This creates a torque generating force in the joint. This enables a targeted movement in every joint of the human body.
Examination of muscular activation
Using the EMG signals from five different muscle groups of the trunk area (2 x back extensors, 1 x side bender and 2 x abdominal muscles), it was examined how different strength devices control and activate these muscles. Only a training device that achieves a clean activation of the target musculature can be used effectively and purposefully during therapy. Finally, the intervention during the therapy period should make it possible to strengthen muscles that may be too weak, overstrained or atrophied and to load them to the approximate maximum range of motion and thus move them to a positive adjustment. Such targeted training can improve the strength, mobility and coordination of the muscles and at the same time increase the patient's self-efficacy, for example after an operation or after a rehabilitation stay. Thus, the coping with everyday life is improved or made possible in the first place. In the same way it is possible to prevent a disease or to prevent its development completely with effective devices on a preventive level.
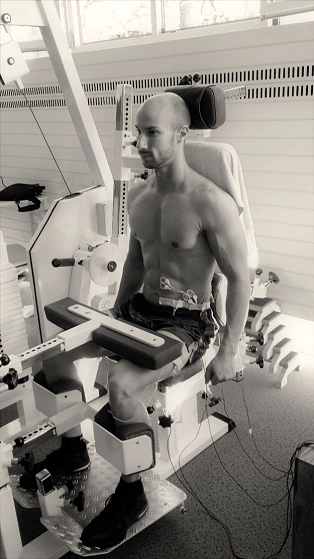 Figure 2: Measurement of muscle activity in the abdominal muscles.Measurement of muscle activity in the abdominal muscles Muscular activation was measured in a total of six different training devices. Three of them were rotatory devices and three devices from a newly developed series, which work translatory. In the former case, the user moves the weight on a circular path around the fixed centre of rotation; in the translatory case, the user pushes himself and the load away from him on a linear path. From each group, one device was intended for activating the back-extending and one for the lateral trunk muscles. The third device was used to activate the abdominal muscles. The main focus of the study was to compare muscle activation in both groups of devices relative to a predetermined maximum activation level (MVC). This means that the higher the relative activation to the respective MVC value, the higher the excitation in the muscle during the exercise. With this type of examination, it is generally critical to note that in an EMG measurement no statement can be made about an increased use of muscle force due to higher amplitudes in the graphs or higher frequencies. The statement can therefore only be made relative to the maximum level of tension or the duration of activity of the respective musculature.
Measurement and evaluation with DASYLab
The latest version of the measurement software DASYLab, which was simple and directly compatible with the hardware used, was used for signal acquisition and evaluation. All necessary drivers could be downloaded directly and free of charge from the homepage of National Instruments. This made it possible to dispense with an additional intermediate A/D converter on the hardware side for transferring the raw data to the PC. In this respect, the decision to use DASYLab 2016 was easy. In addition, processing the data using DASYLab is very user-friendly. The drag & drop system used is intuitive to use. DASYLab provided all the modules and mathematical constructs required for the EMG investigation and thus greatly facilitated the processing of large amounts of data and the further evaluation of the raw data.
For the investigation, an exact interaction of the sampling rates based on the Nyquist theorem and the subsequent translation of the incoming data from the musculature to the PC was particularly important. In DASYLab 2016, these and all other associated settings could be easily made via the interface configurator. Furthermore, the requirements for good filter systems (low-pass and high-pass filters) as well as precise averaging of the measured values were important, since the measured raw values had to be positive, filtered and averaged. This reduced interference coupling into the measurement signal, even if not all interference (ECG signals) could be perfectly eliminated.
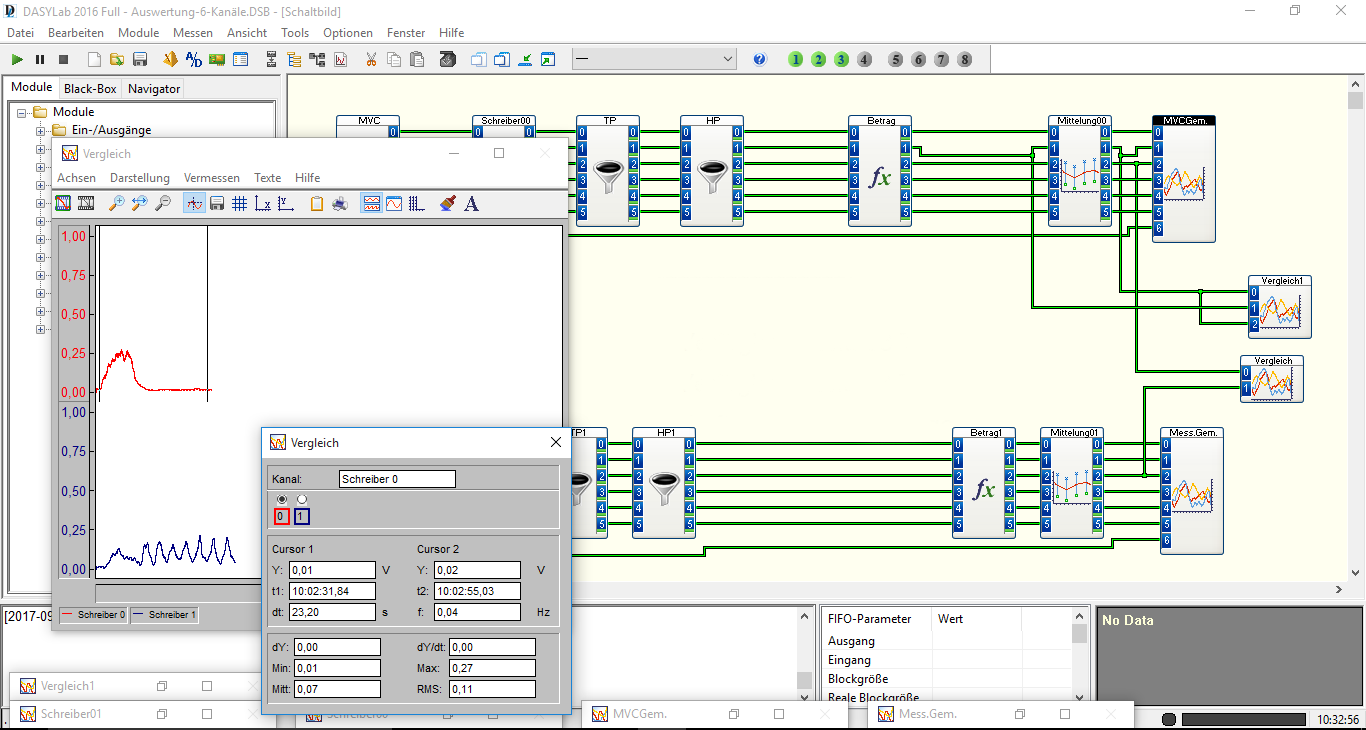 Figure 3: Creating a positive, averaged and filtered EMG measurement curve with DASYLab 2016.
After all the raw data had been processed, the results were displayed using the various graphics tools in DASYLab 2016, and the direct evaluation function was used to examine the respective mean value over several periods for the respective maxima (Figure 3). Based on this, all further evaluations and interpretations of the results were also continued on a statistical level. Thanks to different colors or display formats, the up to 16 incoming measurement channels were clearly displayed in the selected graphs. This made it much easier to compare the data with each other.
All necessary steps for an optimal measurement recording were guaranteed in DASYLab 2016. It was even possible to design user-specific special trigger functions for the EMG measurement. This meant that each repetition could be clearly separated from the subsequent one. The output of acoustic signals at the start and end of the measurement greatly supported the execution of the test during the individual measurement runs. All necessary steps - from the beginning of the recording and storage of the raw data to the processing, evaluation and graphical display of these data from all channels - could be carried out completely in DASYLab 2016 without the need for further software.
1 Basmajian, J.V, & De Luca, C. J. (1985), Muscles alive – Their function revealed by Electromyography, Baltimore, Williams Wilkins