

Custom look and feel
DASYLab offers a wide range of options for designing a working environment that meets the user’s specific requirements:
- Look of the user interface
- User guidance in the individual applications
- Generation of reports and logs
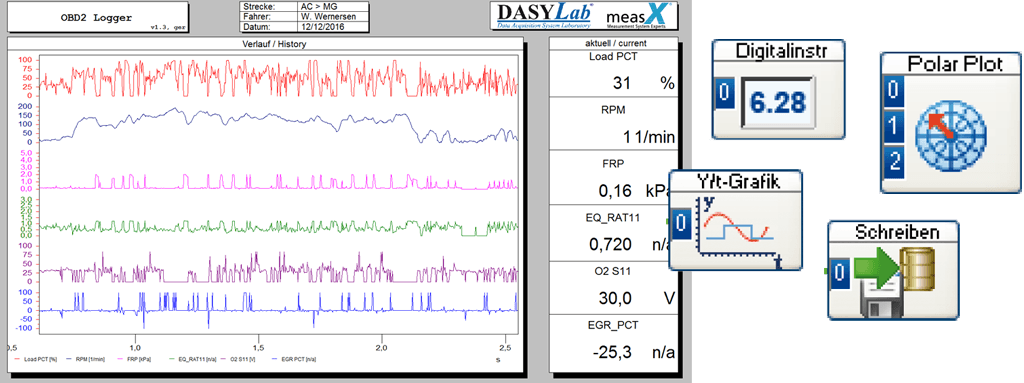
Online visualization
A wide range of control and display modules are available for interface design. These range from standard functions, such as the magnified display of graphical signal sequences, to color-coding of numerical values that violate defined limits.
You can quickly and easily configure all operating elements and display windows to meet your needs by positioning the visualization and control modules and providing them with texts and graphics. Up to 200 different layout pages can be defined with the aid of the integrated layout tool.
Recorded measurement data can be displayed numerically, in table form or as graphs. Freely scalable analog instruments, bar charts and state displays are especially suitable for presenting process and test controls.
Reports and documentation
DASYLab also assists the user in professional presentation of the results. Log sheets and reports can be flexibly designed and configured. You can adapt the printouts to your printer and have them output manually or triggered by events during or after the measurement.
Next Highlight: Extensions